Brian McKay
Co-Founder & Lead Data Architect- Automated Online Rate Data Aggregation
- Location-Based Rate Tables
- Bank & Credit Union Health Safety Ratings
- Bank & Credit Union Star Ratings
- Finance Calculators
Most and Least Affordable Cities to Buy a Home November 2026
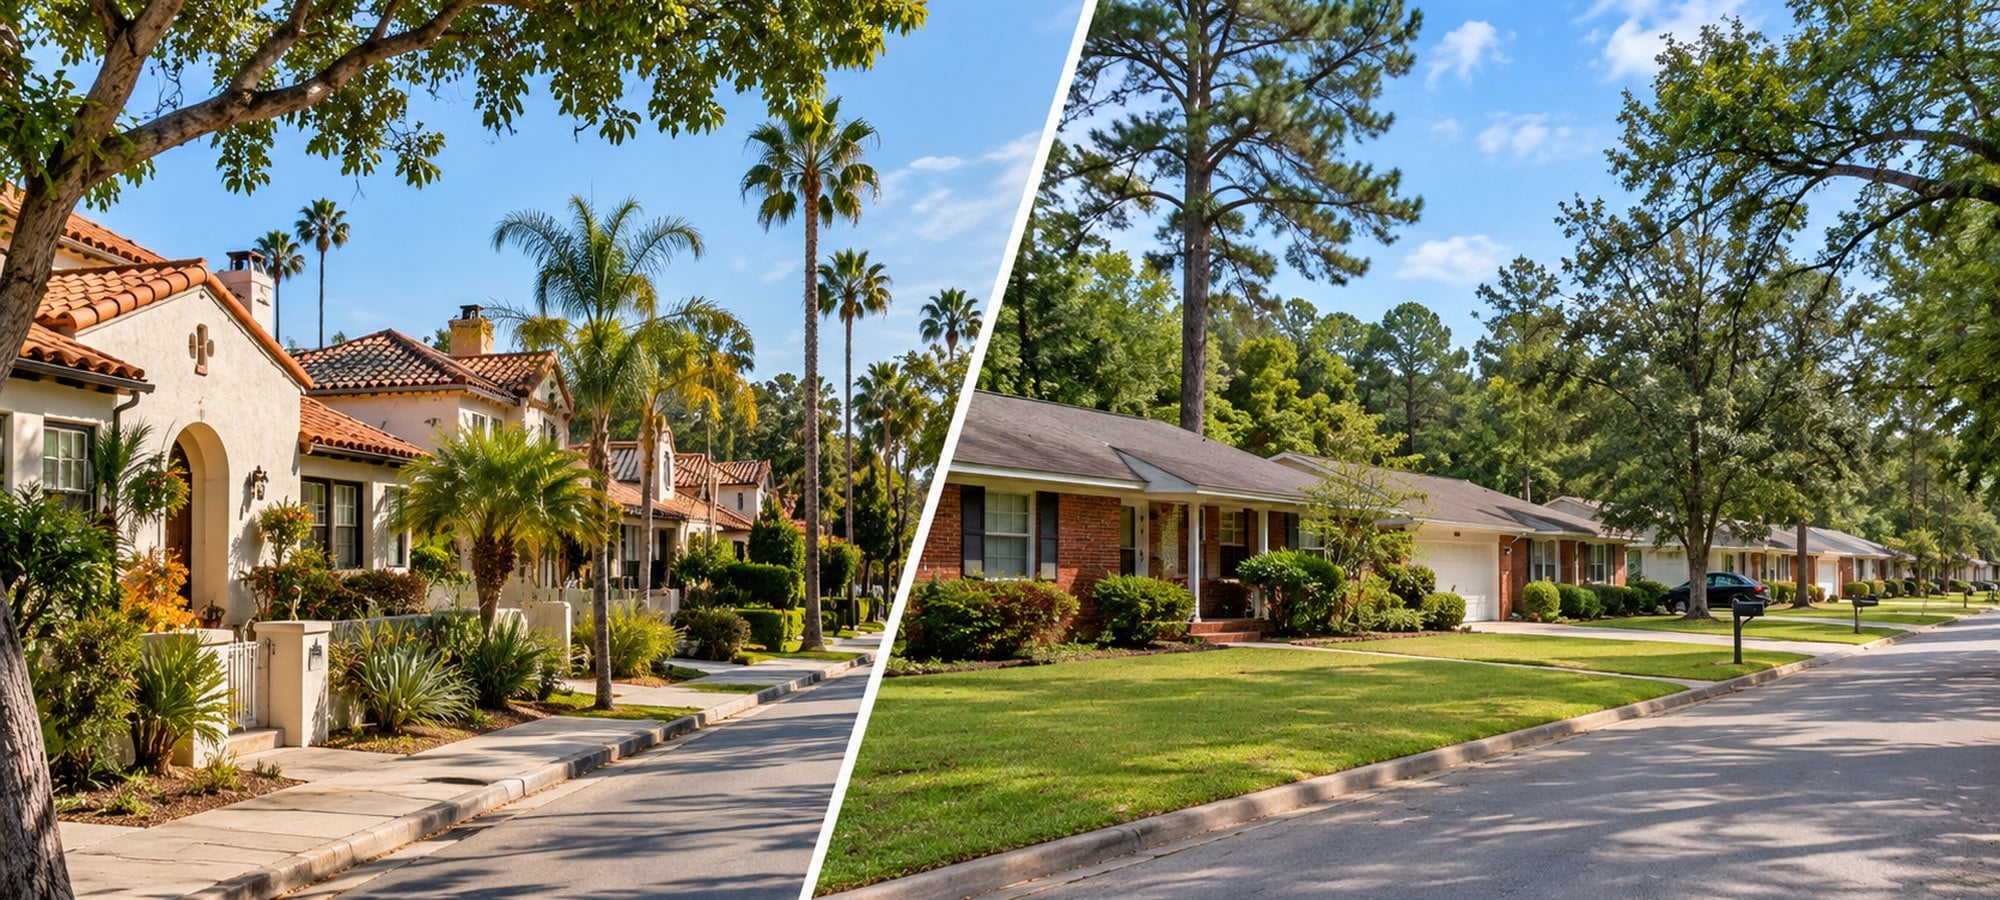
Glendale, California is the least affordable big city in the country to buy a home, and Montgomery, Alabama is the most affordable. In Glendale, the monthly principal and interest on the median home takes 81.7% of the median household’s income; in Montgomery it takes 18.5%. The MonitorBankRates Housing Affordability Index ranks the 150 largest U.S. cities on the same scale.
Illustration
The MonitorBankRates Housing Affordability Index (MBR-HAI) measures how hard it is for a household earning the local median income to buy the local median home at today’s mortgage rates. Each city’s score combines its home values, household incomes and housing costs from the U.S. Census Bureau with its state’s average 30-year mortgage rate from MonitorBankRates’ daily tracking of thousands of banks and credit unions. A score of 100 is the national baseline; higher scores mean buying a home is more affordable.
Scores as of November 21, 2026. Each city links to its current index page, which updates every night.
Key takeaways
- Glendale, California is the least affordable big city to buy a home, scoring 52.9. Its median home value of $1,102,300 is 12.5 times the median household income of $88,393, and principal and interest with 20% down would come to about $6,021 a month.
- Montgomery, Alabama is the most affordable, scoring 147.4. A $161,900 median home costs about $876 a month, 18.5% of the city’s $56,811 median household income.
- California holds 13 of the 20 least affordable cities and 17 of the bottom 25. None of the 27 California cities in the ranking reaches the national baseline; Bakersfield comes closest at 85.3.
- The most affordable cities cluster in Ohio, Michigan and Alabama. Toledo (137.7), Detroit (136.4), Akron (126.2) and Cleveland (120.2) all rank in the top 8, and Alabama places four cities in the top 20.
- In 15 cities, the payment on the median home takes more than half of the median household’s income, including New York, Los Angeles, San Francisco, Honolulu, Seattle and Miami.
- Rates are not what separates them. State average 30-year rates range only from 7.04% to 7.52%; home prices measured against local incomes drive the gap.
Every city on the map
Each dot is a city, sized by population and colored by its score. Green cities are the most affordable, red the least. States are shaded a lighter tone by their own statewide score. Use the + and − buttons, a pinch or the mouse wheel to zoom in on crowded areas like the Northeast. Click a dot for its score, median home value and monthly payment, and a link to its full affordability page.
Source: MonitorBankRates Housing Affordability Index, November 21, 2026. Free for editorial use with attribution.
The least affordable cities to buy a home
The bottom of the list is mostly California. Glendale and Los Angeles hold the last two spots, and 13 of the 20 lowest scores belong to California cities, from San Diego and San Jose to Anaheim, Long Beach and Oakland. In Los Angeles, the median home value of $921,200 is more than 11 times the median household income, and the payment would take 73.7% of it.
New York ranks third from the bottom at 59.4, with the payment on its $777,600 median home taking 63.3% of income. Outside California and New York, the bottom 20 includes Honolulu, Newark, Miami, Boston, Seattle and Portland. Honolulu scores 64.7, with the payment on its $843,400 median home taking 62.5% of income.
The 10 least affordable cities
| # | City | MBR-HAI | Median home | Payment share |
|---|---|---|---|---|
| 150 | Glendale, CA | 52.9 | $1,102,300 | 81.7% |
| 149 | Los Angeles, CA | 54.6 | $921,200 | 73.7% |
| 148 | New York, NY | 59.4 | $777,600 | 63.3% |
| 147 | Long Beach, CA | 61.1 | $806,600 | 60.5% |
| 146 | Anaheim, CA | 61.9 | $831,200 | 57.2% |
| 145 | Newark, NJ | 61.9 | $373,700 | 47.2% |
| 144 | Oakland, CA | 62.0 | $929,900 | 60.0% |
| 143 | Miami, FL | 62.1 | $518,100 | 54.0% |
| 142 | Huntington Beach, CA | 63.0 | $1,100,000 | 59.6% |
| 141 | San Diego, CA | 63.0 | $906,700 | 55.0% |
Payment share: monthly principal and interest on the median home with 20% down at the state’s average 30-year rate, as a share of median monthly household income.
The most affordable cities to buy a home
Montgomery leads the country at 147.4. Its median home value is 2.9 times its median household income, the kind of ratio that has not been common in most big cities in years. Toledo (137.7) and Detroit (136.4) follow, and Detroit’s $83,900 median home value is the lowest of any city in the ranking.
Most of the cheapest places to buy are in the industrial Midwest and the Deep South. Ohio has three of the eight most affordable cities in Toledo, Akron and Cleveland. Alabama places Montgomery, Birmingham, Mobile and Huntsville in the top 20. Even within one state the spread is wide. In Texas, Brownsville ranks 6th at 122.3 while Austin, at 79.5, ranks 107th.
The 10 most affordable cities
| # | City | MBR-HAI | Median home | Payment share |
|---|---|---|---|---|
| 1 | Montgomery, AL | 147.4 | $161,900 | 18.5% |
| 2 | Toledo, OH | 137.7 | $114,500 | 15.2% |
| 3 | Detroit, MI | 136.4 | $83,900 | 14.0% |
| 4 | Akron, OH | 126.2 | $122,000 | 16.7% |
| 5 | Fort Wayne, IN | 122.8 | $188,900 | 20.7% |
| 6 | Brownsville, TX | 122.3 | $139,900 | 17.8% |
| 7 | Birmingham, AL | 120.8 | $158,800 | 22.4% |
| 8 | Cleveland, OH | 120.2 | $102,000 | 16.5% |
| 9 | Wichita, KS | 119.9 | $190,800 | 19.5% |
| 10 | Mobile, AL | 119.4 | $193,300 | 23.4% |
How much of a paycheck the mortgage takes
Lenders generally like to see housing costs at or below 28% of gross income. In 15 of the 150 cities, principal and interest alone on the median home would take more than half the median household’s income, before property taxes or insurance. In Glendale it would take 81.7%; in Detroit, 14%.
A low price does not guarantee a high score. Newark, New Jersey has a median home value of $373,700, close to the middle of the pack, yet ranks among the 10 least affordable cities because its median household income of $52,060 is one of the lowest in the ranking.
Payment on the median home as a share of median income: the eight highest and the four lowest
Red bars are the eight highest shares, green bars the four lowest. The dashed line marks the 28% guideline.
State scores
The same index at the state level. West Virginia, Arkansas and Alabama are the most affordable states; California, Hawaii and Massachusetts are the least. Click a state for its affordability page and every scored city in it.
National baseline = 100; higher is more affordable. Scores as of November 21, 2026. Click a state for its affordability page.
Free to reuse with the citation shown on the image.
All 150 cities: score, home value, income and payment
| # | City | MBR-HAI | Median home | Payment |
|---|---|---|---|---|
| 1 | Montgomery, AL | 147.4 | $161,900 | $876/mo |
| 2 | Toledo, OH | 137.7 | $114,500 | $629/mo |
| 3 | Detroit, MI | 136.4 | $83,900 | $466/mo |
| 4 | Akron, OH | 126.2 | $122,000 | $670/mo |
| 5 | Fort Wayne, IN | 122.8 | $188,900 | $1,058/mo |
| 6 | Brownsville, TX | 122.3 | $139,900 | $772/mo |
| 7 | Birmingham, AL | 120.8 | $158,800 | $859/mo |
| 8 | Cleveland, OH | 120.2 | $102,000 | $560/mo |
| 9 | Wichita, KS | 119.9 | $190,800 | $1,052/mo |
| 10 | Mobile, AL | 119.4 | $193,300 | $1,045/mo |
| 11 | Pittsburgh, PA | 118.9 | $205,800 | $1,122/mo |
| 12 | Buffalo, NY | 118.4 | $164,200 | $896/mo |
| 13 | Memphis, TN | 118.0 | $169,000 | $924/mo |
| 14 | Augusta, GA | 116.4 | $178,400 | $974/mo |
| 15 | Huntsville, AL | 115.8 | $293,600 | $1,588/mo |
| 16 | Des Moines, IA | 114.7 | $194,700 | $1,061/mo |
| 17 | Amarillo, TX | 113.2 | $196,900 | $1,086/mo |
| 18 | Columbus, GA | 112.3 | $193,900 | $1,059/mo |
| 19 | Fayetteville, NC | 110.8 | $188,000 | $1,034/mo |
| 20 | Little Rock, AR | 110.4 | $236,400 | $1,293/mo |
| 21 | Indianapolis, IN | 109.6 | $224,800 | $1,259/mo |
| 22 | Laredo, TX | 108.9 | $193,500 | $1,067/mo |
| 23 | Lexington, KY | 108.9 | $293,500 | $1,614/mo |
| 24 | Clarksville, TN | 108.8 | $263,600 | $1,441/mo |
| 25 | Grand Rapids, MI | 108.7 | $244,500 | $1,358/mo |
| 26 | Louisville, KY | 108.1 | $233,900 | $1,286/mo |
| 27 | El Paso, TX | 107.9 | $184,500 | $1,018/mo |
| 28 | Corpus Christi, TX | 107.4 | $210,400 | $1,160/mo |
| 29 | Knoxville, TN | 106.8 | $239,700 | $1,311/mo |
| 30 | Kansas City, MO | 106.2 | $242,900 | $1,334/mo |
| 31 | Rochester, NY | 106.0 | $139,600 | $762/mo |
| 32 | Milwaukee, WI | 105.9 | $184,000 | $1,016/mo |
| 33 | Tulsa, OK | 105.0 | $205,300 | $1,131/mo |
| 34 | Aurora, IL | 104.8 | $274,800 | $1,518/mo |
| 35 | Cape Coral, FL | 102.9 | $373,500 | $2,026/mo |
| 36 | Oklahoma City, OK | 102.2 | $231,300 | $1,275/mo |
| 37 | Winston-Salem, NC | 101.8 | $233,800 | $1,286/mo |
| 38 | St. Louis, MO | 101.5 | $197,500 | $1,085/mo |
| 39 | Jacksonville, FL | 101.2 | $293,700 | $1,593/mo |
| 40 | Newport News, VA | 101.0 | $260,600 | $1,448/mo |
| 41 | Sioux Falls, SD | 100.8 | $292,400 | $1,602/mo |
| 42 | Chattanooga, TN | 100.7 | $283,200 | $1,548/mo |
| 43 | Lubbock, TX | 100.6 | $212,400 | $1,171/mo |
| 44 | Garland, TX | 100.0 | $270,800 | $1,493/mo |
| 45 | Charlotte, NC | 99.9 | $385,700 | $2,121/mo |
| 46 | Overland Park, KS | 99.8 | $413,600 | $2,280/mo |
| 47 | Omaha, NE | 98.1 | $245,500 | $1,345/mo |
| 48 | Cary, NC | 98.1 | $580,200 | $3,191/mo |
| 49 | Grand Prairie, TX | 97.3 | $295,500 | $1,630/mo |
| 50 | San Antonio, TX | 97.1 | $235,700 | $1,300/mo |
| 51 | Columbus, OH | 96.8 | $252,900 | $1,389/mo |
| 52 | Chesapeake, VA | 96.8 | $378,400 | $2,103/mo |
| 53 | Philadelphia, PA | 96.2 | $243,100 | $1,325/mo |
| 54 | McKinney, TX | 96.0 | $471,800 | $2,602/mo |
| 55 | Greensboro, NC | 95.7 | $244,800 | $1,346/mo |
| 56 | Chandler, AZ | 95.6 | $507,800 | $2,779/mo |
| 57 | Virginia Beach, VA | 95.3 | $382,500 | $2,125/mo |
| 58 | Irving, TX | 95.1 | $315,600 | $1,741/mo |
| 59 | Gilbert, AZ | 95.1 | $575,100 | $3,147/mo |
| 60 | Lincoln, NE | 94.8 | $264,000 | $1,446/mo |
| 61 | Mesa, AZ | 94.6 | $408,000 | $2,233/mo |
| 62 | Fort Worth, TX | 94.0 | $303,000 | $1,671/mo |
| 63 | Peoria, AZ | 93.6 | $463,600 | $2,537/mo |
| 64 | Plano, TX | 93.4 | $465,900 | $2,569/mo |
| 65 | Albuquerque, NM | 93.4 | $291,500 | $1,597/mo |
| 66 | Baton Rouge, LA | 93.1 | $234,700 | $1,282/mo |
| 67 | Anchorage, AK | 93.0 | $395,900 | $2,172/mo |
| 68 | St. Petersburg, FL | 92.6 | $371,100 | $2,013/mo |
| 69 | Baltimore, MD | 92.0 | $229,600 | $1,258/mo |
| 70 | Arlington, TX | 91.9 | $304,700 | $1,680/mo |
| 71 | Port St. Lucie, FL | 91.9 | $369,200 | $2,003/mo |
| 72 | Glendale, AZ | 91.4 | $387,500 | $2,121/mo |
| 73 | Tallahassee, FL | 90.9 | $294,400 | $1,597/mo |
| 74 | Norfolk, VA | 90.8 | $289,900 | $1,611/mo |
| 75 | Phoenix, AZ | 90.5 | $420,700 | $2,302/mo |
| 76 | Durham, NC | 90.4 | $392,800 | $2,160/mo |
| 77 | Frisco, TX | 90.3 | $642,100 | $3,541/mo |
| 78 | Houston, TX | 90.3 | $277,800 | $1,532/mo |
| 79 | Tucson, AZ | 90.3 | $266,200 | $1,457/mo |
| 80 | North Las Vegas, NV | 90.2 | $404,400 | $2,187/mo |
| 81 | Colorado Springs, CO | 89.6 | $452,600 | $2,498/mo |
| 82 | Boise, ID | 88.5 | $484,800 | $2,645/mo |
| 83 | St. Paul, MN | 88.3 | $294,500 | $1,622/mo |
| 84 | Spokane, WA | 88.1 | $363,500 | $2,016/mo |
| 85 | Raleigh, NC | 87.9 | $415,800 | $2,287/mo |
| 86 | Henderson, NV | 86.8 | $484,900 | $2,622/mo |
| 87 | Tempe, AZ | 86.8 | $455,400 | $2,492/mo |
| 88 | Dallas, TX | 86.3 | $320,700 | $1,769/mo |
| 89 | Cincinnati, OH | 85.9 | $230,900 | $1,268/mo |
| 90 | Bakersfield, CA | 85.3 | $371,700 | $2,030/mo |
| 91 | Tampa, FL | 84.8 | $420,400 | $2,281/mo |
| 92 | Nashville, TN | 84.5 | $413,600 | $2,261/mo |
| 93 | Aurora, CO | 84.5 | $469,100 | $2,589/mo |
| 94 | Las Vegas, NV | 84.3 | $427,900 | $2,314/mo |
| 95 | New Orleans, LA | 84.0 | $315,700 | $1,724/mo |
| 96 | Minneapolis, MN | 83.7 | $362,200 | $1,994/mo |
| 97 | Atlanta, GA | 83.6 | $439,600 | $2,400/mo |
| 98 | Chicago, IL | 83.0 | $334,100 | $1,846/mo |
| 99 | Vancouver, WA | 82.6 | $462,400 | $2,564/mo |
| 100 | Madison, WI | 82.4 | $372,900 | $2,059/mo |
| 101 | Elk Grove, CA | 82.2 | $630,100 | $3,442/mo |
| 102 | Richmond, VA | 80.8 | $353,000 | $1,961/mo |
| 103 | Modesto, CA | 80.5 | $442,700 | $2,418/mo |
| 104 | Reno, NV | 80.3 | $548,300 | $2,965/mo |
| 105 | Fresno, CA | 79.7 | $374,800 | $2,047/mo |
| 106 | Stockton, CA | 79.5 | $440,900 | $2,408/mo |
| 107 | Austin, TX | 79.5 | $555,300 | $3,063/mo |
| 108 | Denver, CO | 78.9 | $616,000 | $3,399/mo |
| 109 | Salt Lake City, UT | 78.7 | $539,500 | $2,950/mo |
| 110 | Orlando, FL | 78.3 | $394,100 | $2,138/mo |
| 111 | Scottsdale, AZ | 77.4 | $789,800 | $4,322/mo |
| 112 | Salem, OR | 77.3 | $416,900 | $2,290/mo |
| 113 | Sacramento, CA | 76.1 | $506,300 | $2,766/mo |
| 114 | Moreno Valley, CA | 75.7 | $503,700 | $2,751/mo |
| 115 | Tacoma, WA | 75.6 | $479,600 | $2,659/mo |
| 116 | Worcester, MA | 75.4 | $374,400 | $2,018/mo |
| 117 | Fort Lauderdale, FL | 74.5 | $486,700 | $2,640/mo |
| 118 | Fremont, CA | 74.4 | $1,403,800 | $7,668/mo |
| 119 | Hialeah, FL | 73.6 | $392,000 | $2,127/mo |
| 120 | Providence, RI | 72.9 | $362,200 | $1,973/mo |
| 121 | Yonkers, NY | 72.0 | $501,600 | $2,738/mo |
| 122 | Fontana, CA | 71.9 | $586,800 | $3,205/mo |
| 123 | Jersey City, NJ | 71.8 | $566,900 | $3,105/mo |
| 124 | Washington, DC | 71.5 | $737,100 | $4,076/mo |
| 125 | San Bernardino, CA | 71.2 | $422,300 | $2,307/mo |
| 126 | Oxnard, CA | 70.6 | $652,700 | $3,565/mo |
| 127 | Riverside, CA | 70.0 | $584,800 | $3,194/mo |
| 128 | Santa Clarita, CA | 69.7 | $784,700 | $4,286/mo |
| 129 | Santa Ana, CA | 68.9 | $713,000 | $3,895/mo |
| 130 | Eugene, OR | 68.3 | $460,400 | $2,529/mo |
| 131 | Santa Rosa, CA | 68.3 | $713,900 | $3,900/mo |
| 132 | Portland, OR | 68.2 | $581,500 | $3,195/mo |
| 133 | Seattle, WA | 67.4 | $938,600 | $5,205/mo |
| 134 | Chula Vista, CA | 66.9 | $758,700 | $4,144/mo |
| 135 | Ontario, CA | 66.4 | $607,600 | $3,319/mo |
| 136 | San Jose, CA | 66.4 | $1,233,200 | $6,736/mo |
| 137 | San Francisco, CA | 65.8 | $1,394,500 | $7,617/mo |
| 138 | Boston, MA | 65.7 | $731,700 | $3,943/mo |
| 139 | Honolulu, HI | 64.7 | $843,400 | $4,507/mo |
| 140 | Irvine, CA | 64.6 | $1,191,500 | $6,508/mo |
| 141 | San Diego, CA | 63.0 | $906,700 | $4,953/mo |
| 142 | Huntington Beach, CA | 63.0 | $1,100,000 | $6,009/mo |
| 143 | Miami, FL | 62.1 | $518,100 | $2,811/mo |
| 144 | Oakland, CA | 62.0 | $929,900 | $5,079/mo |
| 145 | Newark, NJ | 61.9 | $373,700 | $2,047/mo |
| 146 | Anaheim, CA | 61.9 | $831,200 | $4,540/mo |
| 147 | Long Beach, CA | 61.1 | $806,600 | $4,406/mo |
| 148 | New York, NY | 59.4 | $777,600 | $4,245/mo |
| 149 | Los Angeles, CA | 54.6 | $921,200 | $5,032/mo |
| 150 | Glendale, CA | 52.9 | $1,102,300 | $6,021/mo |
Rank 1 is the most affordable. Click a column to sort. Rate is the state’s average 30-year fixed rate on November 21, 2026.
What a buyer can do about it
Your own numbers won’t match your city’s score. The score uses the median home and the median income, and you may be buying above or below either one. The piece you control most is the rate. Lenders often quote the same borrower a quarter point apart or more, and on a $400,000 loan that’s about $65 a month. Compare current offers on the mortgage rates page, and check your city’s affordability page for the income a home there takes.
About the MonitorBankRates Housing Affordability Index
The MonitorBankRates Housing Affordability Index (MBR-HAI) scores how affordable it is to buy the median home on the median household income. City scores use U.S. Census Bureau American Community Survey 5-Year Estimates (2024) for home values, incomes and housing costs, combined with the state’s average 30-year fixed mortgage rate, computed daily from the rates MonitorBankRates tracks at banks and credit unions. A score of 100 equals the national baseline; higher scores are more affordable. The ranking covers the 150 most populous U.S. cities by the Census Bureau’s 2025 population estimates. Full details are on the methodology page.
How MonitorBankRates average rates are compiled
MonitorBankRates tracks the mortgage rates banks and credit unions publish on their own websites. Every night, we compute the average 30-year fixed rate from each lender’s most recent quote, so the average reflects every lender we track, not only those that changed rates that day. Averages are based on the APR each lender quotes, which includes most lender fees, and quotes outside a reasonable range for the product are left out. The national average uses all tracked lenders. State averages use the lenders in that state and are smoothed so a single day with only a few quotes cannot swing them; when a state has too few quotes on a given day, its gap from the national average carries forward from the prior day. The rates on this page are the averages for November 21, 2026.
This report is for general information and is not financial advice. Medians describe typical conditions in each city, not the price or rate any buyer will get.
Does your city’s score match what you’re seeing?
Shopping for a home, or just bought one? Tell us what prices and rates look like where you live. Comments also appear in the Rate Seekers Community.
Log in to your Rate Seekers Community account to comment.
Log in