
This is the first edition of what will become a monthly housing affordability briefing. Each month going forward, this report will summarize the prior month’s movement in the index, highlight the markets where affordability shifted most, and explain the rate dynamics driving the score built on the same daily lender data that powers the live index.
Headline Numbers for May 2026
Four numbers anchor every monthly MBR-HAI report. They are the data points that move the score, that change month-to-month, and that determine whether housing is becoming more or less affordable for the typical U.S. buyer.
National MBR-HAI score: 100.7, near the National Average. The national reading sits 0.7 index points above the 100 baseline, which is computed at a 6.5% reference rate. With the actual 30-year average running below that reference at 6.30%, qualifying income requirements are slightly more favorable than the long-run norm, lifting the composite reading just above 100.
30-year fixed rate average: 6.302% computed from MonitorBankRates’ live rate database. A 0.25% change in the national 30-year average shifts the MBR-HAI by approximately 0.8 to 1.0 index points. At current levels the rate is roughly 20 basis points below the reference baseline, which is the primary driver of the slightly-above-100 reading.
Verified rate quotes powering the index: 8,816 sourced directly from the official websites of 1,724 reporting institutions. These are not rate-sheet averages, not third-party estimates, and not survey responses. Every quote is time-stamped and institution-attributed in the underlying database, which is what allows the index to update every morning rather than once a month or once a week.
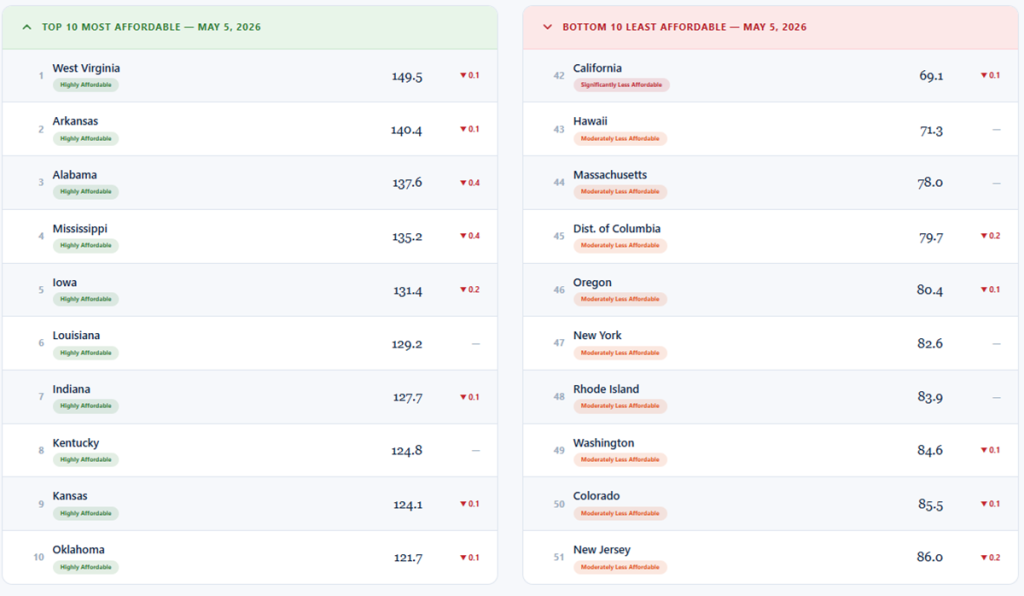
State range: 80.4 points from West Virginia at 149.5 (Highly Affordable) to California at 69.1 (Significantly Less Affordable). The spread between the most and least affordable states is the widest of any housing affordability measure currently published in the U.S., and it is what makes the state-level breakdown the most actionable part of the report for buyers, lenders, and journalists covering regional housing markets.
Why Daily Lender Data Matters for an Affordability Index
The MBR-HAI is the only U.S. housing affordability index updated daily using live mortgage rates from verified lenders. Every other major affordability measure, including the National Association of Realtors’ Housing Affordability Index, uses estimated, surveyed, or lagged rates and publishes once per month or once per quarter. That delay matters more than it sounds, because it means published affordability scores can be four to six weeks behind actual market conditions at any given time.
MonitorBankRates currently aggregates 8,816 verified mortgage rate quotes from 1,724 lenders every night. The aggregation system pulls quotes directly from each institution’s public-facing rate page, the same place a borrower would see the rates and verifies them against a structured database. When the Federal Reserve changes the Fed Funds rate, or when the 10-year Treasury moves, or when lender pricing competition intensifies, those rate changes appear in the MBR rate database by the next morning. The index recomputes from that fresh data nightly, so the score that publishes each morning reflects what lenders are actually offering, not what they were offering a month ago.
The composition of the underlying rate panel matters too. The 1,724 institutions tracked by the index include FDIC insured banks of every size, the largest national lenders, regional banks, community banks and NCUA chartered credit unions across all 50 states and the District of Columbia, with rates pulled directly from each institution’s own public website. That breadth is why the 30-year average is genuinely representative of what a buyer would encounter when shopping for a mortgage. The full breakdown of how the rate component flows into the index, including the 28% qualifying income threshold and the eight Census-derived components, is documented in the full methodology.
How the State Picture Looks This Month
The state-level breakdown reveals the affordability story that the national score smooths over. While the U.S. composite sits near the 100 baseline, individual state scores range from the upper 140s to the high 60s — meaning the typical buyer’s experience varies enormously based on geography. Census-derived components like median home value, household income, property taxes, and cost-burden percentages create the bulk of that geographic spread. Mortgage rates layer on top, but the local price-to-income gap is what drives most of the differentiation.
Top 5 Most Affordable States — May 2026
1. West Virginia — 149.5 (Highly Affordable). West Virginia tops the index by a meaningful margin, with the gap between #1 and #2 wider than the gap between any other two adjacent states. Low median home values combined with reasonable income levels relative to housing costs produce the most favorable affordability score in the country, even with mortgage rates running near the national average at 6.302%.
2. Arkansas — 140.4 (Highly Affordable). Arkansas sits well above the affordability threshold thanks to a combination of below-average home prices and a 30-year rate of 6.166% — among the lower state-level rate averages in the country.
3. Alabama — 137.6 (Highly Affordable). Alabama’s score reflects strong owner-cost ratios across the state, particularly outside the Birmingham and Huntsville metro cores, with a 30-year average of 6.300%.
4. Mississippi — 135.2 (Highly Affordable). Mississippi rounds out a Deep South cluster at the top of the rankings, with a 30-year rate of 6.268% feeding into the index.
5. Iowa — 131.4 (Highly Affordable). Iowa is the highest-ranked Midwestern state and the only state outside the South in the top five — a reflection of strong income-to-price ratios across both metropolitan and non-metropolitan counties, with a state-level 30-year average of 6.129%.
Bottom 5 Least Affordable States — May 2026
51. California — 69.1 (Significantly Less Affordable). California is the only state in the “Significantly Less Affordable” band on the entire map. The state’s 30-year rate average of 6.362% is in line with the national average, but median home values across the state push the qualifying income required for the typical home well beyond what local income data supports.
50. Hawaii — 71.3 (Moderately Less Affordable). Hawaii has the lowest 30-year rate of any state at 5.907% — reflecting unique local lender competition — but the rate advantage cannot offset the highest median home values in the country.
49. Massachusetts — 78.0 (Moderately Less Affordable). Massachusetts is the highest-ranked state in the bottom group, pulled down by Eastern Massachusetts home values that dominate the state’s composite.
48. District of Columbia — 79.7 (Moderately Less Affordable). D.C.’s tight housing supply and elevated price-to-income ratio offset rate readings that are otherwise in line with the national 30-year average.
47. Oregon — 80.4 (Moderately Less Affordable). Oregon’s score reflects affordability pressure that extends well beyond the Portland metro — statewide income-to-price gaps drag the composite into the less-affordable band even with reasonable rates.
The geography in the rankings is consistent with what U.S. Census data has shown for years: the Deep South and rural Midwest dominate the top, while West Coast, Northeast, and Mountain West states cluster at the bottom. What the MBR-HAI adds is the ability to track how those state rankings shift with daily rate movement — something that monthly or quarterly indexes simply cannot do.
What the National Reading Tells Buyers
A national score of 100.7 means the typical U.S. buyer in May 2026 is encountering affordability conditions almost exactly in line with the long-run baseline — not the elevated stress that characterized late 2023 and 2024 when rates were above 7%, but not the favorable conditions that characterized the years leading up to the 2022 rate cycle either. The current 30-year rate of 6.30% is roughly 20 basis points below the 6.5% reference rate baked into the index baseline, which is what produces the slightly-above-100 reading. If rates were to drop a quarter point, the national score would lift to roughly 101.5 to 101.7. If rates were to climb a quarter point, the score would drop to roughly 99.7 to 99.9.
For buyers shopping a mortgage right now, the practical implication is that rate dispersion across lenders matters more than where the average is headed in any given week. The 8,816 verified quotes that feed into the MBR-HAI typically span a range of more than a full percentage point between the highest-priced and lowest-priced 30-year offerings on any given day. Buyers who shop multiple lenders — rather than accepting the first quote — capture meaningful affordability gains regardless of where the index sits. Anyone preparing to apply can compare current 30-year mortgage rates from the same daily database that produces the index, and run scenarios through a mortgage affordability calculator to translate the rate environment into a personal home-price ceiling. For more on how rate movement at the headline level connects to actual buyer outcomes, this guide on How Mortgage Rates Affect the Home Buying Process walks through the relationships in detail.
What to Watch Heading Into June
Three variables will most influence next month’s MBR-HAI reading.
The June 16-17 FOMC meeting. The Fed’s next decision and updated dot plot will reset the rate path expectations that drive the 10-year Treasury and, indirectly, 30-year mortgage rates. The April hold by the Fed was unusually contested, with a four-dissent split that suggested less-than-firm internal consensus. June’s projections will reveal whether that consensus is tightening or fracturing further. Tightening toward additional cuts pulls mortgage rates and the MBR-HAI lower; tightening toward no cuts holds rates near current levels.
May CPI data. The April CPI print released in mid-May, followed by May CPI in mid-June, will determine whether inflation is decelerating enough to support cuts or remaining sticky enough to keep rates elevated. The MBR-HAI rate component will reflect any sustained move within days, given how quickly mortgage rates respond to inflation surprises.
Lender pricing competition. Even with the Fed and Treasury markets steady, lender margins shift independently. The 8,816 daily quotes powering the index pick up these competitive moves before they show up in published averages elsewhere. A meaningful narrowing of the lender spread would signal increased competition for purchase volume and would shift the index even without any move in benchmark rates.
For ongoing tracking between monthly reports, the live national reading and all 51 state scores update every morning on the MBR Housing Affordability Index, and the underlying rate inputs are visible on the national mortgage rate trends page. Next month’s edition of this report will recap the full month’s movement and the state-level shifts that drove it.
About the MBR Housing Affordability Index
The MonitorBankRates Housing Affordability Index is a 9-component composite that combines a qualifying-income mortgage formula with eight Census-derived measures: median home value, median household income, the price-to-income ratio, conforming loan limit access, median selected monthly owner costs, property tax burden, homeownership and homeowner vacancy rates, and owner and renter cost-burden percentages. The rate component updates daily; Census components update annually each December when new American Community Survey 5-year estimates are released; CPS/HVS market-condition components update quarterly. The full component-by-component formula and weighting are documented in the methodology page.
The index is published free of charge for editorial, academic, and policy use. Press citations should reference “MonitorBankRates (MBR) Housing Affordability Index, MonitorBankRates.com” and link to the methodology page. Daily national and state scores in CSV format are available for download from the live index page.
Frequently Asked Questions
What is the MBR Housing Affordability Index?
The MBR Housing Affordability Index (MBR-HAI) is a daily-updated composite score that measures how affordable U.S. homeownership is relative to the long-run national baseline. A score of 100 equals the baseline; scores above 100 indicate more favorable affordability conditions than the long-run norm; scores below 100 indicate tighter conditions. The index is computed using live mortgage rate data from 8,816 verified rate quotes across 1,724 banks and credit unions, combined with U.S. Census Bureau housing, income, and cost-burden data.
How is the MBR-HAI different from the NAR Housing Affordability Index?
The NAR HAI uses a single formula based on median family income and the qualifying income needed for a median-priced home, publishes once per month, and uses Freddie Mac’s weekly rate survey as its rate input. The MBR-HAI uses 9 components across 5 categories, publishes daily, and uses actual mortgage rates aggregated from 8,816 verified quotes from 1,724 lenders rather than survey-based estimates. The MBR-HAI also adds property taxes, total owner costs, and cost-burden data that the NAR HAI does not include.
Why is the May 2026 national score 100.7?
The score reflects the 30-year mortgage rate average of 6.302% running approximately 20 basis points below the 6.5% reference rate baked into the index baseline, lifted slightly above 100 by the favorable rate spread. The other eight components (Census-derived) are unchanged from their December 2025 ACS update and will refresh again in December 2026.
Where does the rate data come from?
From 8,816 verified mortgage rate quotes captured each night from 1,724 FDIC-insured banks and NCUA-chartered credit unions reporting to MonitorBankRates.com. Every quote is sourced directly from the official rate page of the institution — the same place a consumer would see the rate — not from rate sheets, third-party estimates, or survey responses.
Why do some states have scores below 50 and others above 140?
The state spread reflects how dramatically different median home values and incomes are across the U.S. West Virginia’s 149.5 reading is driven by low median home values relative to local income, with mortgage rates only modestly different from the national average. California’s 69.1 reading is driven by median home values that push qualifying income requirements far above what local income data supports, even with rates roughly in line with the national average. Geography is a bigger driver of affordability outcomes than rate dispersion is.
How often will this report publish?
This is the first edition of a monthly MBR Housing Affordability Index report. Each month’s report will recap the prior month’s movement, highlight the markets where affordability shifted most, and document the rate dynamics driving the index. Live daily scores remain available continuously on the index page between monthly reports.
Can I download the historical MBR-HAI data?
Yes. Daily scores for the national average and all 51 states are available as CSV downloads from the index page. The files include the index score, the 30-year rate used in the calculation, and the date for each observation, suitable for use in Excel, Google Sheets, or any analytical environment.
Where can I track the index between monthly reports?
The live national reading and all 51 state scores update every morning on the MBR Housing Affordability Index page. The underlying rate inputs — the 30-year fixed national average and individual state averages — update on the mortgage rate trends page. Both pages reflect the same daily lender data that powers this monthly report.


