
For homebuyers and homeowners watching mortgage rates, the more useful question is not what the Fed announces today — it is what the path looks like through the rest of 2026 and into 2027. The relationship between Fed policy and mortgage rates is less direct than most people assume, but the Fed’s projections, combined with the inflation outlook, do shape where 30-year fixed rates are likely headed.
Why Mortgage Rates Don’t Move with the Fed
This is where most homebuyers get tripped up. The Fed sets the federal funds rate, which directly affects short-term borrowing costs — credit cards, auto loans, savings account yields, the prime rate. Mortgages are different. 30-year fixed mortgage rates track the 10-year U.S. Treasury yield much more closely than they track the federal funds rate.
The 10-year Treasury yield is set by the bond market, not the Fed. It reflects what investors collectively believe about future inflation, economic growth, and the path of Fed policy over the next decade — not just the next meeting. As a result, mortgage rates often move ahead of Fed decisions as the market prices in expectations, then move very little when the actual decision lands.
This explains a confusing pattern from late 2024 and 2025. The Fed cut rates by 175 basis points between September 2024 and December 2025, bringing the federal funds rate from 5.25%–5.50% down to the current 3.50%–3.75%. Over the same period, 30-year mortgage rates barely moved. That is not a malfunction — it is the bond market saying, “we already priced these cuts in months before they happened, and we are not pricing in many more from here.”
Where Mortgage Rates Stand Today
According to Freddie Mac’s Primary Mortgage Market Survey for the week ending April 23, 2026, the 30-year fixed-rate mortgage averaged 6.23% — the lowest level in the last three spring homebuying seasons. The 15-year fixed averaged 5.58%. Daily rate trackers show slight upward pressure this week ahead of the FOMC decision, with Mortgage News Daily’s index for April 28 showing the 30-year fixed at 6.38% — two-week highs.
That pre-meeting volatility is normal. Markets reposition ahead of FOMC days regardless of how predictable the outcome is. The more meaningful number is the trend: 30-year rates have been gradually working lower from the 7%+ peak of late 2023, but the pace of decline has slowed considerably as the market’s view of total Fed easing has shrunk.
For buyers comparing loan structures, the gap between 30-year and 15-year fixed rates is currently around 65 basis points. Whether that spread justifies the higher monthly payment of a 15-year mortgage depends on the buyer’s situation — the trade-off is laid out in detail in our guide on 30-year vs. 15-year mortgages.
What the March 2026 Dot Plot Implies for Mortgage Rates
The dot plot is the visual summary from the Federal Reserve’s quarterly Summary of Economic Projections, showing where each of the 19 FOMC participants expects the federal funds rate to be at year-end. The official source is the Federal Reserve’s March 18, 2026 SEP. Here is what it showed:
- Year-end 2026 median: 3.4% — implying one 25-basis-point cut from current levels.
- Year-end 2027 median: 3.125% — one additional cut next year.
- Longer-run rate: 3.125% — drifted up to its highest level since 2016.
The CME FedWatch Tool, which reflects what the futures market is actually pricing, is somewhat more cautious. Prediction markets put the highest probability on zero cuts in 2026 (roughly 40%), with one cut at 28% and two cuts at 16%. Either way, more than one cut this year is now considered unlikely.
For mortgage rates, the implication is straightforward: if the dot plot is roughly right, mortgage rates likely stay in the 6.0%–6.5% range through the rest of 2026, with potential to drift toward the high 5s in 2027 if inflation cooperates. If the more cautious FedWatch view plays out, the move lower is even smaller.
The real wild card is inflation. The March 2026 Consumer Price Index came in at 3.3% year-over-year — up from 2.4% the prior month — driven largely by a 10.9% energy index spike tied to the conflict with Iran. The 10-year Treasury yield embeds inflation expectations directly, so sustained 3%+ CPI prints keep mortgage rates elevated regardless of Fed action. A de-escalation in the Middle East would likely pull mortgage rates lower; further escalation pushes them higher.
The Affordability Picture: MBR Housing Affordability Index by State
Rates are only half of the affordability equation. The other half is home prices, which have continued to rise in most metros even as rates have moderated. Tracking the combined effect on what a typical homebuyer can actually afford is the purpose of the MBR Housing Affordability Index, which combines current 30-year mortgage rates, median home prices, and median household income into a single index value. A reading of 100 means a household earning the median income has exactly enough to qualify for a median-priced home; readings above 100 indicate housing is more affordable than that benchmark, and readings below 100 indicate it is less affordable.
National averages tell only part of the story. State-by-state, the affordability gap between the most and least affordable markets is striking — and it has widened in recent years as coastal home prices have continued rising while interior states have remained closer to long-run norms.
The Most Affordable States
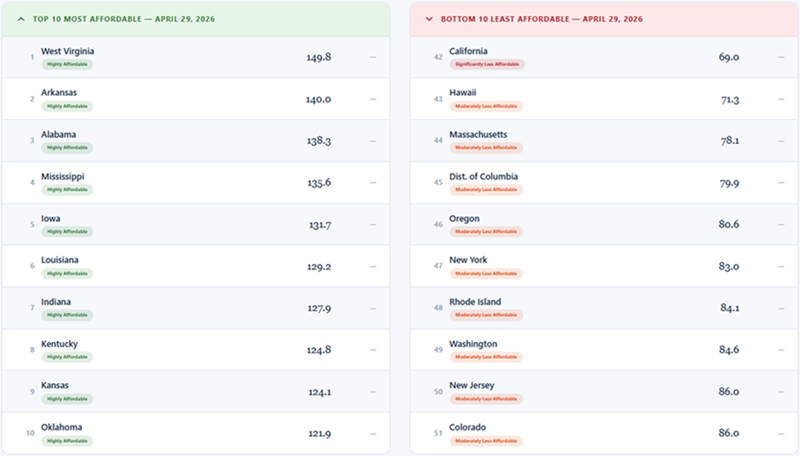
The top of the list is dominated by Southern and Midwestern states. West Virginia leads the rankings at 149.8, followed by Arkansas (140.0), Alabama (138.3), Mississippi (135.6), and Iowa (131.7). All ten of the most affordable states carry the “Highly Affordable” designation, with index readings well above 100. The common thread is moderate home prices relative to local incomes — these are not states with unusually high household income, but states where housing has not run away from local wages the way it has on the coasts.
The Least Affordable States
At the bottom of the list, California sits at 69.0 — the only state in the “Significantly Less Affordable” category. Hawaii, Massachusetts, DC, Oregon, New York, Rhode Island, Washington, New Jersey, and Colorado round out the bottom 10, all in the “Moderately Less Affordable” range. The geographic pattern is unambiguous: the West Coast (California, Hawaii, Oregon, Washington, Colorado) and the Northeast corridor (Massachusetts, DC, New York, Rhode Island, New Jersey) together account for all ten of the least affordable states. Even with rates at multi-year spring lows, a buyer earning the local median income in California qualifies for substantially less house than the median home requires.
The practical implication for buyers is that national mortgage rate news is meaningful but incomplete. A 25-basis-point cut in mortgage rates has very different effects on affordability in West Virginia (where housing is already affordable) versus California (where the gap between income and home prices is the binding constraint). For prospective buyers, running the numbers on a specific purchase scenario using a mortgage calculator with both today’s rates and local home prices is more useful than reacting to national headline numbers.
Until either rates fall meaningfully below 6%, prices stop rising in the high-cost states, or local incomes catch up — and ideally some combination of all three — affordability in the bottom-10 states is unlikely to improve materially. None of the three is on the immediate horizon based on current Fed projections and housing market data.
For Existing Homeowners: The Refinance Question
Refinance activity has picked up modestly this spring as rates have come off the late-2024 highs. Freddie Mac data showed refinance applications increasing alongside the rate decline, though volume remains well below pre-2022 levels because most existing homeowners are sitting on mortgages with rates well below current levels.
The refinance math is straightforward: a refinance generally makes sense when the new rate is at least 75–100 basis points below the current rate, the homeowner plans to stay in the home long enough to recoup closing costs, and the monthly savings are meaningful relative to those costs. For a homeowner with a 7%+ mortgage taken out in 2023, today’s rates around 6.23% are within reach of that threshold. For anyone holding a 4% or 5% mortgage from before 2022, the math does not work and is unlikely to work in 2026 unless the dot plot proves dramatically wrong to the downside.
The trickier scenario is homeowners with rates in the 6.5%–7% range who are wondering whether to refinance now or wait for further rate declines. The answer depends on how much the rate would actually drop and how long they plan to stay in the home. The when to refinance guide walks through the full breakeven analysis.
What This Means for Buyers and Owners
The combined message from today’s expected hold, the dot plot, and the FedWatch tool is one of patience. Mortgage rate relief is coming, but slowly, and the bulk of the easing has been pushed further into the future than markets hoped at the start of 2026. A few practical takeaways:
- If you are house shopping now, rates around 6.2%–6.4% are likely close to the best you will see for the rest of 2026 unless inflation drops sharply. Locking in when you find the right home is more sensible than waiting for a meaningfully lower rate that may not arrive.
- If you are weighing 30-year vs. 15-year, the current 65-basis-point spread is tighter than the historical average. The 15-year is more attractive than usual relative to the 30-year for buyers who can afford the higher payment.
- If you have a high-rate mortgage from 2023–2024, running the refinance numbers at current rates is worth your time. The window has opened.
- If you have a sub-5% mortgage, sit tight. Nothing in the current rate outlook suggests refinance math will work for you in 2026.
For ongoing context on where mortgage rates are trending, our national mortgage rate trends page tracks weekly movement across loan types and terms.
Frequently Asked Questions
Will mortgage rates go down after today’s Fed meeting?
Probably not in any meaningful way. Markets have already priced in a hold at this meeting, so the actual announcement is unlikely to move mortgage rates much. The bigger driver of mortgage rates over the rest of 2026 will be inflation data and the 10-year Treasury yield, not today’s FOMC decision specifically. Powell’s press conference may move rates slightly if his commentary on the path forward is meaningfully more hawkish or dovish than the market expected.
Why don’t mortgage rates follow the federal funds rate?
Mortgage rates track the 10-year Treasury yield much more closely than the federal funds rate. The 10-year yield is set by markets and reflects expectations about future inflation, economic growth, and Fed policy over a much longer horizon than the next FOMC meeting. As a result, mortgage rates can move in the opposite direction from the federal funds rate in the short term, and they typically move ahead of Fed decisions as markets price in expectations rather than reacting to them.
What does the Fed dot plot say about 2026 mortgage rates?
The March 2026 dot plot’s median projection points to one 25-basis-point cut in 2026 and one more in 2027, ending 2027 at 3.125%. Translated to mortgage rates, that path implies 30-year rates likely staying in the 6.0%–6.5% range through the rest of 2026, with potential to drift toward the high 5s in 2027 if inflation cooperates. The CME FedWatch tool is pricing somewhat fewer cuts than the dot plot, which would mean less downward pressure on mortgage rates.
Should I wait for lower mortgage rates before buying?
Based on current Fed projections and the inflation outlook, meaningful rate relief is unlikely before late 2026 at the earliest, and home prices in most markets continue to rise. Waiting for both lower rates and lower prices may mean waiting through 2027 or beyond — and home prices may be higher then even if rates are lower. The traditional wisdom applies: marry the house, date the rate. Buy when you find the right home and refinance later if rates fall meaningfully.
Should I refinance my mortgage now?
A refinance generally makes sense when the new rate is at least 75–100 basis points below your current rate, you plan to stay in the home long enough to recoup closing costs (typically 2–4 years), and the monthly savings are meaningful relative to those costs. For homeowners with mortgages above 7% from 2023, today’s rates around 6.23% may meet that threshold. For anyone with a sub-5% mortgage from before 2022, refinancing is not likely to make sense in 2026 unless rates drop far more than the dot plot projects.
What is the MBR Housing Affordability Index?
The MBR Housing Affordability Index combines current 30-year mortgage rates, median home prices, and median household income into a single index value showing how affordable housing is. A reading of 100 means a household earning the median income has exactly enough to qualify for a median-priced home; readings above 100 indicate housing is more affordable, and readings below 100 indicate it is less affordable. The index is published nationally and by state, with state-level readings revealing the wide affordability gap between Southern and Midwestern states (typically the most affordable) and West Coast and Northeast states (typically the least affordable).


